INTRODUCTION Naser Alnaser
The experiment is all about Solidworks about thermal loading. In this experiment, the objective is to determine the current carrying capacity of a nichrome wire when subjected to forced convection and free convection and to determine the necessary current to melt a section of the nichrome wire itself. The laboratory experiment will be conducted by inputting preliminary amperage into the simulation system. The simulation is run, and the resulting temperature of the nichrome wire and the heat transferred through convection is acquired. The simulation will be repeated with different currents until the recorded temperature and convection heat transfer is closest to the wire’s melting point. The significance of this lab is that being able to conduct thermal analysis in calculating temperatures and heat transfer in components of a design and its environment will ensure that future designs will be safer and easier to diagnose. Meaning, designing and troubleshooting designs will be much safer and easier because thermal loads are more controllable. For motivation, performing this lab successfully will allow the construction of a physical model of computational fluid dynamics and thermal models that will be used in the next laboratory activities.
BACKGROUND Salem Almahri
Thermal loading refers to the temperature impacts on buildings due to internal and external air (space) temperature or solar radiation. Three modes of heat transfer are conduction, radiation and convection. All three modes have an impact on causing thermal loading. This involves heat gain and heat loss computation in building structures. (Wada) An equation of heat by which energy is transferred is given below.
Heat transfer rate (W)
Thermal conductivity coefficient (
Area suitable for the normal heat flow
The temperature gradient in respect to the x-direction
In the phase of conduction, heat can flow from higher temperature to lower temperature. The temperature gradient and direction both go opposite directions. This results in equal to a negative sign. This negative sign and the negative attached to the same equation (1); we can expand it to accommodate a flat wall with uniform temperature and on each surface.
(2)
Where is the thermal resistance defined by:
(3)
These equations help verify the rate of heat flow in the walls of these building structures. Many R-values will be needed to figure out how the walls were built, focusing on the different layers and material used. (Scheer)
The focus will be on convection, radiation and power through a nichrome wire. Steady-state conditions programmed in Solidworks will result in no temperature changes concerning time. The conceptual and simplified equations for energy balance can be rewritten as Equation 4. Where the power applied is a result of current running through resistance and the convection.
(4)
Forced and free air convection can change the energy balance in Equation 4. When more power is applied to the wire in a free-air environment, the wire is at risk of melting. When air is moved over the wire, the heat transfer coefficient is higher, so the wire can have more power through it before it melts.
COMPUTATIONAL METHODS Kiah Brown
The experiment consists of these instruments for measurements and data acquisition:
- Lab computer station with Solidworks
Solid Model. Start Solidworks, then create a “New File”. Click the “Sketch mode” tab as shown in Figure 1.
Select the “Front Plane” icon to choose the plane to be used to start drawing, as shown in Figure 2.
Click “View Orientation” as shown in Figure 3. The “Circle Tool”, as shown in Figure 1, is selected and used to draw a circle on the sketch frame. A circle drawn has a diameter of 0.25mm, which converted to meters in radius is 0.000125. The green checkmark on the left side of the panel can be clicked to refer to circle values, as shown in Figure 3. “Smart Dimension” tool can be used to make changes to the dimensions of the drawing, as shown in Figure 1. Click “Features” and choose both “Extrude Boss/Base” and “Midplane” from the “Direction” dropdown. Extrude circle to a length of 5cm. Save the file as “2_Lab_GroupNumber” (use actual group number). The model is now complete.
Viewing the Model. The model can be 3-D rotated, holding down the scroll wheel on the mouse. Then zoomed in and out of the model using the scroll wheel as well. The “F” key can be used to go back to its original view to fit the screen. The “view orientation” is another option to select a view.
Flow Simulation. When “Flow Simulation” is not available on Solidworks, we can click the “gear” icon instead. Place “Add-ins” as well as display a checkmark on “SOLIDWORKS Flow Simulation”. Once the “Wizard” is selected, there will be steps to follow as far as naming the project and so on. The ANALYSIS TYPE needs to be set up as shown in Figure 4. “Radiation” and “Heat conduction in solids” need to be included. “External” flow and “Gravity” needs to be checked and turned on. Choose “Y” as “Reference axis”. Put checkmarks under “Consider closed cavities” to exclude the options.
The DEFAULT FLUID set-up is on the next page of the wizard, as shown in Figure 5. “Air” and “Add” must be selected. The “Laminar and Turbulent” option should be used.
The next thing to do is to set up the DEFAULT SOLID. The “alloys” tab should be expanded to select Nichrome. Click “Next” and leave the WALL CONDITIONS default as is. Return to the wizard to set up the INITIAL AND AMBIENT CONDITIONS as shown in Figure 6. Use room temperature in Kelvin for both “Temperature” and “Initial solid temperature”.
Velocities must be left at zero. Finish the wizard. On the right side of the corner is the units drop-down box. Make sure “MKS” is displaying the units in SI. Next, set up the computational domain by clicking the “Computational Domains” shown in Figure 7. The volume arrows can be dragged to change the size of the volumes, also shown in Figure 7.
Enter values for the domains listed below:
X: +0.03m and -0.03m
Y: +0.1m and -0.02m
Z: +0.04m and -0.04m
Once these values are entered, click on the green checkmark—select “Goals” by right-clicking on it. Select “Insert global goals” and choose: Velocity (max), Heat transfer coefficient (avg & max), Heat transfer rate, Heat transfer rate (convective) and Temperature of solid (max). Click the green checkmark.
Mesh. The computational domain is used to create the mesh. Right-click “Global mesh”. Select “Edit definitions”. Under “Type”, click on the “manual” icon. Enter values for global mesh: Nx = 50, Ny = 80 and Nz = 12. Click the green checkmark. Right-click “Mesh”. Select “Insert a local mesh”. Select “Face 1” after clicking on the wire. Set “Refining Cells” at 2,0 and 2. Click the green checkmark. “Run” to create the mesh. Verify “Solve” is not selected. Click Okay. A new “pop-under” window is displayed to show the status of the operation. Check several mesh cells—close status window. Mesh is completed.
Power dissipation. “Watts dissipated” is entered in the “Input Data” panel. Wire length is 5cm. The initial guess is 3 amps. Calculate total applied power. Enter calculation into “Input Data” by adding a heat source. Right-click project name. Choose “Customize tree”. Click “Add heat source” and right-click on the visible heat source. Select “Insert surface source”. Enter watts dissipated value. Select the wire to see “Face 1”. Click the green checkmark.
Solve. Select “Run” then “Solve”. Deselect “Mesh”. Verify “New Calculation” is selected. Click run. Computational solutions are completed. Right-click “Goal plots”. Select “Insert”, then select all options for results. Click the green checkmark. Record values received to Excel spreadsheet.
Solidworks Overall. Each student takes turns using the computer station to perform computational runs. The computational fluid dynamics (CFD) and thermal modals obtained using Solidworks will be implemented in the next labs.
RESULTS AND DISCUSSION Tashina Lucero
Solidworks used an iterative process to determine convective heat coefficients at two states and the associative current at the melting point of a nichrome wire. The model used a global mesh to fill the majority of the domain. A local mesh was created with a higher concentration of elements at the top of the wire will simulate heat rising to the top.
The iterative process of inputting guesses of the current eventually determined the maximum current and heat transfer coefficient the model wire can sustain before melting. The first input for power dissipation was 10.35W. The power dissipation value is derived from Equation 5, where current (guessed), resistance (given), and length L = .05m (given).
(5)
The resultant convective heat transfer coefficient was recorded for each iteration shown in Table X. The results were compared to publish data and analyzed for error. Free air convection coefficients range from 5-10, while forced-air ranges between 5-1000.
The melting point of nichrome wire is 1673 K; the results were recorded within 100 K of that value. They have values were 19 times higher than the estimated published values for free air convection. Using a forced air simulation, max was within the range of published values. The final results and values are shown in Table 1.
Table 1: Final iteration results
| Max Current, i (A) | Power dissipation (W) | Average Convective heat transfer coefficient, h (W/m^2K) | Max Convective heat transfer coefficient, h (W/m^2K) | The temperature indicated for nichrome wire (K) | |
| Free Air | 4.568321926 | 24 | 194.071 | 270.873 | 1636.15 |
| Forced Air (~10m/s) | 6.114842954 | 43 | 831.456 | 1783.06 | 1605.5 |
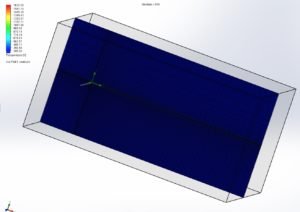
The cut plot in Figures 8a & 8b shows the heat transferring in an upward direction in the free air simulation and a lateral direction for the forced air simulation. The full domain cut plots for each simulation are shown in Appendix B.
Limitations for using computational fluid dynamics are the lack of unforeseen real-world variables that aren’t included in the computation. The simulation is running in an ideal environment. The error can be due to creating the mesh, such as using too few elements or incorrectly placing the mesh.
CONCLUSION Salem Almahri
APPENDIX A: References
Armstrong PhD, Terry. (2018). ME 445 Lab Manual: Lab #2 SOLIDWORKS (Thermal Loading). Las Cruces, NM. New Mexico State University.
Scheer, David. Sustainability Workshop- Autodesk. Accessed 5 February 2018. https://sustainabilityworkshop.dautodesk.com
Wada, Akira. “Commentary on Recommendations for Loads on Buildings”. Architectural Institute of Japan. Dec 2005. Accessed 5 February 2018. https://www.aij.or.jp/jpn/symposium/2006/loads/Chapter8_com.pdf
APPENDIX B: Supporting Tables and Figures

Figure 9: Free air summary screenshot

Figure 10:Forced air summary screenshot

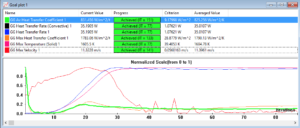
Figure 11:Free air goal plot for the last iteration

Figure 12: Forced air goal plot for the last iteration

Figure 13: Full domain cut plot for free air

Figure 14: Full domain cut plot for forced air
APPENDIX C: Full Spreadsheet
Table 2: Full table of iterations
| Free Air Convection | Forced Air Convection (10m/s) | ||||||
| Current, i (A) | Power dissipation (W) | Convective heat transfer coefficient, h
() |
The temperature indicated for nichome wire (K) | Current, i (A) | Power dissipation (W) | Convective heat transfer coefficient, h () | The temperature indicated for nichome wire (K) |
| 3 | 10.35 | 233.486 | 1237.71 | 6.46058282 | 48 | melted | melted |
| 3.4 | 13.294 | 244.404 | 1349.79 | 6.11484295 | 43 | 1783.06 | 1605.5 |
| 3.8 | 16.606 | 254.244 | 1454.06 | .- | .- | .- | .- |
| 4.37383525 | 22 | 266.942 | 1591.95 | .- | .- | .- | .- |
| 4.93435164 | 28 | melted | melted | .- | .- | .- | .- |
| 4.75486021 | 26 | melted | melted | .- | .- | .- | .- |
| 4.56832193 | 24 | 270.873 | 1636.15 | .- | .- | .- | .- |
APPENDIX D: Raw Data Collection Sheet

Figure 15: Raw data taken during lab


