
Acknowledgment
This project required a lot of help from supervisors and other professors concerning the compilation as well as understanding the technical aspects of this project and different topics covered in it. My professors provided different sources and material to understand the concepts and include in the project.
I have cited those sources to show gratitude. I want to acknowledge that, without the help of my supportive teachers, it would not have been possible for me to complete this project in time. Without their help and coaching, I couldn’t go in the right direction.
I would like to express gratitude to our supervisors who made a positive criticism on the project to rectify different mistakes present in this project and having trust in us.
Introduction
There are many different types of rock found on the planet, each of them exists in various geological locations and the environment of each place has had a huge impact on their physical structure which in turn had an impact on their electrical and thermal characteristics.
Extensive studies behind the nature of electrical materials have been made because of the fact these days every system of our routine life, businesses, work, and industry are entirely based on such electrical devices that are created out of these rocks as raw materials.
Based on the ability of the elements to conduct current they have been identified into three categories, Conductors are those materials which can conduct current freely with the help of the charge carriers known as electrons, insulators are those rocks that don’t conduct electricity under any circumstances and the interesting third category that acts as part conductors because of their limited ability to carry the current charges and are known as semiconductors (Telford, 1990).
Now the rocks exist in three basic forms of the matter solid, liquid, or gas, most of the rocks appear as a mixture of the two or three phases having both the solid or liquid content.
There are solid rocks, molten or igneous rock, and the phenomena through which the current flows through them when an external potential is applied across such rocks is different in these different types. The movement of charge can be ionic, electrolytic, or conductive in the rocks.
The ability of the rocks to oppose the flow of the current is the most important property of each material and this would be discussed in detail in the project. The resistance is defined as the ability to stop the flow of electrons or current and a conductor (Telford, 1990).
There are certain limits for the conductivity based on which the rocks are termed as insulators or conductors and if the value of conductivity lies in between the upper and lower values then they are known as semiconductors (Telford, 1990).
Formation Evaluation requires a different kind of test that is conducted to find out different properties of rocks and fluids, if present in them. There are different methods of formation evaluation. At the time of drilling of a well, formation cuttings coming out from the wellbore are the first source of information.
Mud logs are developed based on the analysis made of cuttings. Different parameters are extracted from those cuttings and these results can be used to confirm the plans of logging a specific interval. If the results from cuttings are somewhat helping and supporting, then logging is made to confirm.
Although, logging is considered to be a part of an agreement between the operator company and Petroleum Minerals regulatory authority.
Whenever a block is acquired by a company, there is a need to complete the work units in that block within the allowed timeframe. Logging is done to confirm the data collected from the cuttings and deep formation evaluation can be done from electrical logging methods.
Literature Review
Electrical Properties Basics
To evaluate formations, the electrical properties of each rock play an important role in determining and evaluating with accuracy. The effect of the electrical properties of rocks changes the parameters determined from logging methods. There are different methods of formation evaluation used after the formation has been drilled down.
Parameters Affecting the Electrical Properties of Rocks
Many factors affect the electrical properties (electrical conductivity, resistivity, electric potentials, and dielectric constant) of rock i.e. moisture, saline water, grain size, grain distribution, pore size distribution, temperature, and pressure, etc.
Among all the electrical properties of rock; electrical conductivity has the most significant which is the property of propagation of electric current in rocks. This propagation is further divided into major categories depending upon the medium of flowing current. (Patnode & Wyllie, 1950)
- Electronic Current: Current flow in material containing free electrons such as the metals.
- Ionic Current: The current is carried by ions in an electrolyte (aqueous or molten rocks).
- Dielectric Conduction: It takes place under the influence of an external varying electric field in poor conductors or insulators, which have very few free carriers or none at all. The electrons are displaced slightly; this slight relative separation of negative and positive charges produce a current known as the displacement current. (Givens, 1986)
Electronic/ Ohmic Conduction
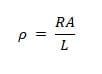
To understand the flow of electric current in the Earth, let’s consider the flow of electric current in a finite volume. Consider a cylinder of length L and cross-section A that carries a current I as shown in the figure below.

Where A is in square meters, L in meters, R in ohms, and ρ is the electrical resistivity of the material in ohms meter (ohm-m). This is the resistance per unit volume and is an inherent property of the material.
If two cylinders are made of the same material, but with different dimensions, they would have the same electrical resistivity, but different electrical resistances. (Patnode & Wyllie, 1950)
According to Ohm’s Law which states for a resistor, Resistance R is defined as the voltage V applied across the ends of the cylinder and the resultant current I flowing through it,

Where V = voltage (volts); I = current flow (amperes) and the resistance (in ohms).
As conductivity is the reciprocal of resistivity it is more convenient to discuss the conductivity (σ) which is measured in Siemens per meter as:

Where J is the current density (A/m2) and E is the electric field (v/m). (Deakin, 1987)
Electrolytic/ Ionic Conduction
Most of the rocks are poor conductors, their resistivity would be extremely large as they are usually porous and the pores are filled with fluids, mainly saline water which makes the rocks as electrolytic conductors, whose effective resistivity may be defined as the propagation of current by ionic conduction.
The current flow is not only slow as compared to Ohmic conduction but represents an actual transport of material. The conductivity of a porous rock varies with the volume and arrangement of the pores and even more with the conductivity and amount of contained water.
An empirical formula was developed for this scenario by Gus Archie. Archie’s Law states that the rock formation factor is the resistivity of brine saturated rock with brine’s resistivity. The equation reads (Archie, 1942)
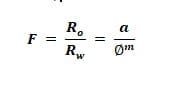
Where;
F = Formation factor
Ro = Resistivity of brine saturated rock
Rw = Resistivity of brine
a = Constant
∅ = Porosity
m = Cementation exponent
On a log-log plot of Ro as a function of Φ, a straight line should result in slope –m. Values of m range from 1.8 to 2.0 for consolidated sandstone and 1.3 for unconsolidated sands.
And,
 Where;
I = Resistivity index
Rt = Resistivity of rock at Sw < 100%
n = Saturation exponent
Typically, laboratory-derived data gives n values between 1.7 and 2.4 however, n is generally assumed to have a value of 2.
Above equations are generally referred to as ‘clean’ samples, but where clays are present large deviations can occur. Empirical corrections for shale effects, i.e. For “m” to m* and n to n* are possible. (Archie, 1942)
Formation Factor (Archie’s First Law)
Archie performed a series of experiments to examine the relationship between the resistivity of rock saturated with various resistivity fluids. He saturated clean sandstones and carbonates with aqueous solutions of varying concentration and resistivity.
Archie discovered that the bulk resistivity of a rock Ro fully saturated with an aqueous fluid of resistivity Rw is directly proportional to the resistivity of the fluid.

Where F is the constant of proportionality called the Formation Factor and describes the effect of the presence of the rock matrix and is a function of porosity and pore geometry and a unitless entity as it’s a ratio between two resistivity values. (Parkhomenko, 2012)
If the rock is fully saturated with the fluid and there is no matrix; F = 1. And if we start adding grains the void spaces will decrease and ultimately fluid saturation will also reduce.
In this case, Ro will increase and fluid conductivity will decrease. It shows that F will always be greater than unity normally its value ranges from 20 and 500. (Archie, 1942)
Another aspect is F describes that grain and the twisting pathways that the current is forced to take through make the conducting fluid more resistive due to the presence of the insulating bulk material. Hence the formation factor includes both the effect of the variable porosity and the effect of the tortuous pathways; the connectivity of pore spaces.
The natural complexity of pore systems in rocks means that the form factor cannot be expressed simply as a function of porosity and connectivity in a theoretically rigorous way.
The formation factor is a material property that changes from rock to rock, and the following rule commonly holds.
Where: m = the cementation index/factor/exponent (no units).
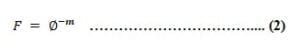
Combining above equations 1 and 2. The resulting equation is called Archie’s First Law.
R_o=R_w ∅^(-m)
In the above expression, m factor is responsible for the increase in resistivity that results from the rock grains forcing the current to take zig-zag pathways through the conducting fluid.
The theoretical values for the cementation factor are unity for uniform pores just like a direct bundle of tubes that penetrate the rock directly from one side of the sample and exit the other side without turbulence or uneven changing pathways. It is zero for a rock with 100% void spaces i.e. no solid rock particle is present in the pathways of flowing fluid. (Archie, 1942)
Due to the complexity of the system and the way pore spaces are arranged cementation factor doesn’t have purely theoretical values. However, in the real system, it usually varies between 1.0 and 3.0.
Rocks like igneous and metamorphic the values vary between 1.0 and 1.4 because they contain fractures which are a form of porosity that is confined and well connected, and hence it has uniform tubes of porosity going through the sample. (Parkhomenko, 2012)
Values between 1.4 and 2.0 are found in sandstones; with the higher values tend to found in more consolidated sandstones, as flowing current pathways are more tortuous.
Carbonates have a larger degree of tortuosity because pores are not well connected which leads to values range between 2.0 and 2.6.
|
Cementation Factor |
Types of Rock |
| 1.0 – 1.4 | Igneous and Metamorphic |
| 1.4 – 2.0 | Sandstones |
| 2.0 – 2.6 | Carbonates |
Methods to Measure Formation Factor and the Cementation Exponent
The formation factor and the cementation exponent can be measured on core samples in the laboratory in the following way;
- Clean and dry the core sample
- Measure the porosity of the sample with the helium method or with a fluid saturation technique
- Now Saturate the rock with a conductive fluid if haven’t already done in the porosity determination step
- Measure the bulk resistivity of the sample saturated with the fluid
- Measure the resistivity of the same fluid that saturates the core sample
- Apply Eq. 1 to obtain the formation factor
- Apply Eq. 2 to calculate the cementation exponent
To calculate the mean value of cementation exponent take to log on both sides of Eq. 2 and rewrite as;
log F = – m log ∅

Figure 1: Cementation Factor from Crossplot
Now by plotting F against ∅ on log-log graph paper, we can obtain a straight line for a given rock type, which intersects F=1 when ∅=1, and with a gradient equal to –m. (Formation Factor Logging by Electrical Methods: Comparison of Formation Factor Logs Obtained in Site and Laboratory, 2003)
Core Analysis
Coring is a process to evaluate the formation sample in the laboratory and perform some experiments to measure different properties such as porosity, permeability, and saturation. To find out the saturation of the core sample obtained from coring requires measurement of different factors such as formation factor, cementation exponent, and tortuosity factor. Some properties get changed because of environmental conditions difference. As the temperature and pressure in the reservoir are different from surface conditions, the properties do not remain the same because of different chemical reactions taking place. (Recommended Practices for Core Analysis, 1998)
Following are the properties which get affected due to environmental change:
| Reservoir Properties | Surface Properties | Cause |
| Swi | Soi | So Reduced |
| Reservoir Temperature | Ambient | Wax Precipitation |
| Formation Brine | Mud Filtrate | Salinity |
| Anaerobic | Aerobic | OxidationReservoir Properties Surface Properties Cause Swi Soi So Reduced Reservoir Temperature Ambient Wax Precipitation Formation Brine Mud Filtrate Salinity Anaerobic Aerobic Oxidation |
When the drilling for a core sample is carried out, the pressure difference at the bottom of the hole is more than the reservoir pressure. This overbalance on the core sample cause mud filtrate loss into the core sample which will affect the properties of the core to some extent.
This filtrate loss causes a change in the properties of the core and some of the contents of materials are also get displaced. Mud particles displace the outer surface of the core sample because of the continuous circulation of mud through the annulus.
The permeability of the rock being drilled also affects the filtrate losses. If the permeability of the rock is more, more will be the filtrate loss in the core sample. (Nelson, 2009)
If more time is taken to cut the core through formation, it will have more time to get filtrate in it. The remaining sample of the core will have original properties because of less invasion of mud filtrate in it.
These properties can be changed and reversed in the laboratory and their effect can be reduced by some treatment but if some reservoirs are water-sensitive and there is some salinity is present in mud, it will change the composition of the rock particles which will bring the change in results and whole core will be destroyed.
The mobility of clay particles can be increased due to salinity of water and if there is any loosely bounded clay content, it will be released and the whole percentage in results will be changed. (Rieu & Sposito, 1990)
Wettability of the rock is also the main factor in determining the behavior of the reservoir and reserve estimation of the reservoir fluid. If the wettability of rock is understood, the amount of fluid present in the rock can be estimated because of the capillary pressure of the fluids.
The addition of surfactants and other mud additives can alter the wettability of the rock and in this case, the fluid in the bigger or smaller pores can be changed which will change the reserve estimated from that core lab. (Okasha & Funk, 2002)
To avoid such damages and changes, it is necessary to perform coring job with lease crude. If the core is retrieved and its water saturation is not changed, the calculation of oil saturation will not be affected. There are different types of coring and core analysis.
Conventional coring and Sidewall coring are the two techniques used for evaluation. Sidewall coring provides an in-depth illustration of reservoir rocks and data of the transitions zone. As the conventional coring is only related to the wellbore and provides the formation sample of the wellbore which is already present in the form of cuttings samples, sidewall coring has a benefit over conventional coring. (Ubani, Adeboye, & Oriji, 2012)
Types of Core Analysis
Each type of core analysis has different purposes or evaluation objectives. Mainly, two types of core analyses are performed in the industry. Different services companies provide services according to the requirement of the client companies. RCA and SCAL are the two methods used for formation evaluation. (Helmet)
Routine Core Analysis
Routine core analysis deals with common and basic fundamental properties of reservoir rocks or other rocks being evaluated. It is nearly impossible to preserve the core properties and environmental conditions to the reservoir conditions level.
But is it is tried to achieve the maximum preservation? Near ambient conditions are achieved when the core sample is received in laboratory and properties can be determined on these environmental conditions and the results are then converted into reservoir conditions with some limitations. (Monicard, 1980)
RCA provides the basic properties such as porosity, permeability, saturation, and lithology of the rock. These basic properties help to determine the storage capacity in the reservoir which can store the fluids in it, the capacity of the reservoir to flow fluids through it.
The percentage of the fluids present in the rock sample and all the properties than can determine whether the wellbore being drilled is economically and commercially acceptable or not. (Anderson, 1975)
Special Core Analysis
The tests are not required by all the companies and are additional to the basic fundamental properties of the rocks. These analyses are required when petro-physical analysis and reservoir engineering studies are to perform on the reservoirs. To perform a special core analysis of the rock samples, laboratory measurements of the following properties are done:
- Capillary Pressure Measurements
- Relative Permeability
- Analysis of Wettability of the rocks
- State of the reservoir whether it is the steady-state flow of unsteady state
- Core-flooding to determine reservoir conditions
- Short time studies to find the effects of IOR and EOR techniques
- Archie equations to determine electrical properties of rocks
- Exponents of Archie’s Equation (Special Core Analysis, 2016)
Cementation Exponent from Special Core Data

To calculate the cementation factor graphically, it is necessary to calculate the porosity of the rock sample and formation factor at different points. When the data of R0 and Porosity is plotted on y and x-axis respectively, the best-fitted line gives the results of A and M. where A is Archie’s Constant and M is Cementation Exponent.
Both factors should be plotted on log-log axes. The best-fitted line must cut at the value Porosity = 1. At this point, the slope of the line will give M. Some of the times, the data does not pass through the pinned line. In this case, the non-linear approach of marching is done. The intercept on the y-axis will give the value of A.
As an illustrative example, figure 1 is showing the method to determine the cementation factor from core data. (Krygowski)
Saturation Exponent from Special Core Data
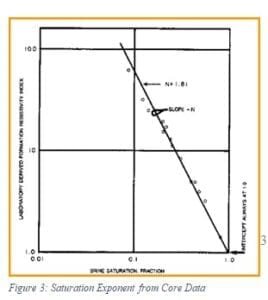
To measure the saturation exponent, the results of total resistivity, resistivity index of the core sample, and water saturation are required. If we plot the total resistivity index at different water saturations on log-log axes, the best-fitted line with the intercept on Sw will give the saturation
exponent for that core sample. To get accurate and reasonable results of the saturation exponent, data from different wells with the same formation type will be required. If no data is available other than a single core sample, its results will be acceptable. (Wildenschild, Roberts, & Carlberg, 1999)
Factors affecting Saturation Exponent
Saturation exponent is used to defining the efficiency of the rock to flow or transmit the electricity through it in the presence of a non-conductive fluid which can be a hydrocarbon or any other medium.
There are different properties of rocks as well as fluids present in rocks which affect the value of saturation exponent. Saturation exponent is although less critical and sensitive to change than cementation exponent.
Following are the properties which affect the value of saturation exponent:
- Reservoir Pressure and Temperature
- Mineralogy of the rocks
- Pore and throat size distribution in the rocks
- The geometry of the pores in which these are aligned
- Wettability of the rocks (Electrical Properties of Rocks, 2015)
Cation Exchange Capacity
The measure of the number of positive charges accommodated by the anionic surface of clay or similar mineral or material is known as cation exchange capacity. The measurement unit of this quantity is milliequivalent per 100 grams. The chemical composition of clay minerals is aluminum-silicates.
Due to the presence of some of the silica and aluminum ions on the surface of the clay, sometimes they are replaced by the ions which are less in valence charge than aluminum.
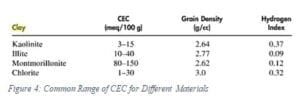
For example, the replacement of aluminum ion with ferric ion leaves a negative charge on the surface of the clay particles. In this way, multiple negative charges are created on the surface of clay minerals or similar materials.
These negative charges attract cations from other materials. In the petroleum industry and these measurement methods, this is sometimes expressed in the units of
milliequivalent per unit volume of the material. Different materials have different values of CEC depending upon the capacity of each material. (Borden & Giese, 2001)
CEC plays an important role in information evaluation because CEC is responsible for electrical properties. Wet Chemistry and membrane potential are two of the methods being used for measurement of the Cation Exchange Capacity of the core samples.
Conductometric titration is used in wet chemistry experiments in which alteration of the core sample is done. Spontaneous Potential and Formation Resistivity is changed by the change in CEC which is measured directly by salinity and membrane potential methods of measurement.
Electrical Properties from Multiple Salinity Method
To measure the electrical properties of the shaly core sample, multiple salinity method is used. The brine of different salinities is prepared and the core samples are flushed with each different salinity brine. After each flush of different salinity brine, the electrical conductivity of the sample is checked and recorded.
A plot of conductivity of the sample against the conductivity of the brine is drawn. With this graph, additional conductivity can be determined which can be due to the presence of electrically conductive material in clay or surface material.
Intrinsic Formation Factor and Porosity Exponent can be determined after fitting this data with the most suitable data model. (Electrical Properties of Rocks, 2015)
The most useful method for curve fitting and data analysis is the Waxman-Smits, Dual Water Model. It also tells about the Cation Exchange Capacity. The primary measurements in every core analysis are the measurement of bulk density and grain density of the core sample. Through which the porosity can be calculated.
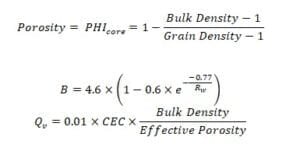
In some of the literature sources, it is claimed that the porosity determined from this method is the total porosity of the rock. But in actual, this porosity includes the bounded water with clay as well. Which counts this as effective porosity of the rock.
If the analysis of this rock is made based on the Dean-Stark model, then the effect of bounded water is no more with this porosity value,
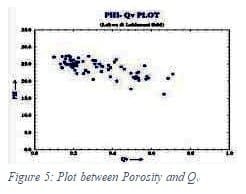
which shows that the porosity is now the total porosity of the rock sample. In this method, the clay conductivity is considered as a function of CEC because of Qv. Qv is the CEC per unit volume and B is the mobility of positive ions in clay particles.
After fitting the expressions with Archie’s equation, the relation between formation factor, Resistivity index, and water saturation is developed and it can be concluded that the saturation of water also has a relation with CEC. (Morgan & Fulton, 1951)
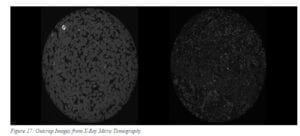
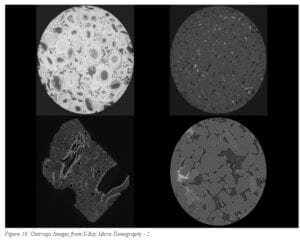
Electrical Properties from Micro CT Scans
The electrical properties of the rocks can also be determined digitally by using different electrical methods such as CT Scans. CT Scan will show the image of the pore sizes of the rocks and the distribution of the particles in the rocks.
Different software is used to solve the electrical equations developed by using the Laplace method and Finite elements. Through these equations, electrical potential fields are solved at different boundaries.
The total current volume of the sample can be determined by summing up the electric current field at the pores individually. The formation factor can also be calculated through this method. (Electrical Properties of Rocks, 2015)
Carried Out Investigations
Different raw samples of rocks were taken to investigate the electrical properties of rocks. To experiment, five samples of heterogeneous rocks were gathered. There were two sandstones, two limestones, and one carbonate rock.
The size of each sample was in the range of 50 to 100mm and a diameter of nearly 40mm. the porosity of carbonate rock was maximum while the lowest porosity was of tofu limestone which was 3.1%.
For image acquisition and processing, these samples were imaged at a high resolution using x-ray tomography. Avizo Fire 9.1 was used for processing these images. iThreshold was applied to convert these processed images in grey segmented images. The resolution at which these images were processed was 4 micrometers.
Porosity, pore distribution, and grain size measurements were carried out by 3D segmented images. Different researches show that the increase in brine percentage in the causes of the decrease in resistivity of the sample. This happens because of the amount of ions increases in the sample which increases the conductivity of the sample.
The increase in temperature of the environment also causes an increase in the conductivity of the sample with a reduction in the resistivity of the sample.
X-ray Micro-Tomography
There are different techniques invented by researchers that can generate images of the materials. X-ray Tomography is one of those techniques. The advantage of this technique is that it can create a 3D image of the material structure and the structure remains intact.
Doctors and Medical Researchers use this technique to research and diagnose the new diseases and no remedy has been developed. Initially, this technique was just only limited to the medical field, but now it has gained recognition in the engineering industry and especially it is being used in the material sciences engineering and oil industry to look at the structure of the materials and rock particles.
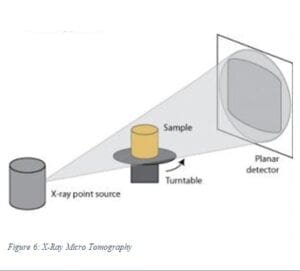
Distribution of minerals, pore size distribution, high-resolution imaging to determine the fluid passage in the rock particles and other investigations can be carried out using this apparatus. Instruments with different pixels are used depending upon the need of resolution required for particular research.
The type of pixel required is mainly dependent on the type of research, the size of the particle being researched as well as the objective of the research. In the oil industry, the understanding of pore and grain size distribution is necessary to plan different stimulation jobs in which matrix acidizing and wettability alteration are the major ones.
The texture of the matrix of rock is necessary to understand as it helps to understand the location of a one-grain particle concerning another one. (MacDowell, 2007)
Each technology has some advantages and disadvantages over other technologies. X-Ray Micro Tomography also has pros and cons. To distinguish between different materials, it depletes the X-ray and this depletion in amount is different for different materials.
Sometimes, this ray overlaps and it becomes impossible to separate two different materials. (Worthington, 1975) To distinguish two different materials, there is a need for multiple characteristics because these cannot be distinguished based on a single factor.
In the new coming technologies of tomography, the problem is solved by measuring it at different levels of energy due to which materials can be distinguished easily. (Salvo, et al., 2003)
This experiment can help determine the following parameters:
- Identification of Grains
- Information about the shape of the grain
- Grain Size Distribution
- Location of the grain in the block
- The orientation of the grains in a specific block(Gaillard, et al., 2007)
Results & Discussion
Grain and Pore Size Distribution
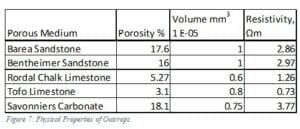
Figure 7, Figure 8 and Figure 9 show the calculations performed on the five samples of outcrops. To find out volumes of the core samples, it was necessary to measure the dimensions of the core samples.


After measuring the volumes, the samples were dipped in the solution of brine and saturated. The resistivity of those five samples was measure after when the electricity at different frequency current was passed through these samples. Figure 8 & 9 show the calculations of grain and pore size distribution of the rock samples.
Figure 10 and Figure 11 show the results of pore size and grain size distribution in different samples taken from rocks. Each pore is considered to be a cube and number of grains and their frequency is measured in an excel sheet. After calculation, it is estimated that how much percentage of the grains has maximum pores volume. Both graphs are related to pore and grain size distribution.
Grain size distribution analysis is done by using a sieve analysis in which meshes of different sizes are used and the size of grains is determined accordingly. When the grain size is more, there is more chance of getting conductive material in the formation and in this case, the conductivity of the formation will increase.
The sorting of the sediments also plays an important role in determining the conductivity of the formation. If the sediments are well-shaped and rounded, it will make the formation porous, and more fluid can be available in the pores.

Formation Factor
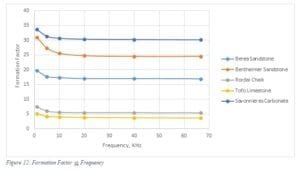
At the smaller frequency of current passing through the saturated samples, the formation factor drop is more and after the value of frequency more than 20KHz, it becomes consistent. As per literature, this was initially thought that the value of the form factor is constant and does not change with the change in resistivity of water.
But after the research, it was concluded that the resistivity factor is only constant for those rocks which do not have conductive solids and minerals in them. Most of the rocks have conductive minerals in them and this is why the resistivity of the rocks affects the ratio of resistivity of water to total resistivity.
The form factor of the conductive rocks is known to be an apparent formation factor whose effect is dampened by the presence of minerals. (Sethi, 1979)
This experiment also shows the result of the presence of different minerals either conductive or nonconductive in different samples of rocks. The composition of each rock sample is different and this is why the porosity and different rock properties are different for these rocks.
As the saturation of water depends on the pore size distribution and matrix alignment, the resistivity is also affected by the presence of different minerals and changes in water resistivity. According to one relation, the form factor is dependent on the porosity, tortuosity factor, and cementation factor of the rocks.
Each of these factors is dependent on the rock properties and sedimentation pattern, this is why all the rocks have different values of formation factor. Figure 12 is showing the same discussion trend for different rock samples. (Bakke & Eric, 1997)
From the graphical representation of the results, it can be concluded that the conductivity of the rocks is also dependent on the frequency of the current being passed through it. Different samples show different behavior when an electronic current is passed through it. (Loucks, Reed, Ruppel, & Jarvie, 2009)
The trends in the graph show that the sandstones show a drop in the formation resistivity factor for the range of frequency from 0 to 20 kHz – 25 kHz. Similarly, limestone and chalk have less formation factor value and the increase in the frequency of electric current does not affect it much. There is a sudden drop in formation resistivity factor of carbonate reservoirs but it gets stable earlier at low-frequency voltages as well. (Greensmith, 1988)
Similarly, studies have shown that different factors affect the properties of rocks. The effect of pressure and viscosity on the rocks and their physical properties is unavoidable. When the production or injection of the well is in progress, the opening and closing of pore spaces and cracks also change the porosity of the rocks. The production of the fluids from rocks makes the pore pressure reduced and the pores of the rocks are closed. This discontinuity of the pore spaces also reduces the conductivity or resistivity of the rocks. (Lucia, 1995)
Figure 12 and Figure 15 show the trends of the form factor of different formations against porosity and frequency of the current flow through the formation samples. According to these trends, it can be seen that the increased formation factor shows increase more porosity of the rocks. This trend shows the general trend of different rocks at the same levels. But on the other hand,

Figure 16 shows the calculation of pore distribution in the rocks based on the formation factor. This figure shows that the percentage of pores and the form factor of the pores is more in the range of pore fraction from 11 – 100.

Conclusion
From all the discussion and research work, it can be concluded that material composition and pores and grains distribution is the deciding factor for fluid accommodation as well as the results deduced from electrical measurement devices are also dependent on these properties.
These properties affect the results of wireline logs which are the primary factor of determining whether well will be tested or not. If the data gathered from wireline logging and coring are not promising, the well will be plugged and abandoned or suspended.
In this research project, the basic objective of using these investigation techniques was to give an idea about these methods and to determine the effect of different factors on these measurements. Grain and pore size distribution was calculated using representative Elementary Volume of the rocks.
A total of five samples of different rocks were taken to investigate the heterogeneity and pore size distribution of the rocks. Through the calculations, it was observed that the pore size was different from one particle to another and there was no homogeneous size of particle was present in the rocks.
It was also observed that the calculation of the form factor can also give an idea of the porosity and saturation of water. The results of the form factor are severely affected by the microstructure of the materials.
If there are conductive particles are present, the resistivity of the rock sample will be changed and the results will not be reliable. Therefore, different correction factors must be applied before presenting these results and making conclusions.
References
Anderson, G. (1975). Coring and Core Analysis. Tulsa: PennWell Books.
Archie, G. E. (1942). The Electric Resistivity Log as an aid in determining some Reservoir Characteristics. AIME, 54-62.
Bakke, S., & Eric, P. (1997). 3-D Pore-Scale Modelling of Sandstones and Flow Simulations in the Pore Networks. SPE Journal, 14.
Borden, D., & Giese, R. F. (2001). BASELINE STUDIES OF THE CLAY MINERALS SOCIETY SOURCE CLAYS: CATION EXCHANGE CAPACITY MEASUREMENTS BY THE AMMONIA-ELECTRODE METHOD. Clays and Clay Minerals, 444-445.
Deakin, M. J. (1987). Wettability, Formation Resistivity Factor, And Excess Conductivity. Society of Petroleum Engineers, 13.
Electrical Properties of Rocks. (2015, January 01). Retrieved from Crain’s Petrophysical Handbook: https://www.spec2000.net/09-elecprop.htm
Formation Factor Logging by Electrical Methods: Comparison of Formation Factor Logs Obtained in Site and Laboratory. (2003). Journal of Contaminant Hydrology, 107-115.
Gaillard, J.‐F., Chen, C., Stonedahl, S. H., Lau, B. L., Keane, D. T., & Packman, A. I. (2007). Imaging of colloidal deposits in granular porous media by X‐ray difference micro‐tomography. Geophysical Research Letters.
Givens, W. W. (1986). Formation Factor, Resistivity Index, And Related Equations Based Upon A Conductive Rock Matrix Model (CRMM). Society of Petrophysicists and Well-Log Analysts, 19.
Greensmith, T. G. (1988). Petrology of the Sedimentary Rocks. Springer Netherlands.
Jelmert, T. A. (n.d.). Core Analysis. Norway : NTNU.
Krygowski, D. (n.d.). Archie, Hingle, and Pickett: Determining fluid saturation. Retrieved from The Discovery Group: http://www.discovery-group.com/pdfs/Archie%20Hingle%20Pickett.pdf
Loucks, R. G., Reed, R. M., Ruppel, S. C., & Jarvie, D. M. (2009). Morphology, Genesis, and Distribution of Nanometer-Scale Pores in Siliceous Mudstones of the Mississippian Barnett Shale. Journal of Sedimentary Research, 848-861.
Lucia, J… (1995). Rock-Fabric/Petrophysical Classification of Carbonate Pore Space for Reservoir Characterization. AAPG, 1275-1300.
MacDowell, A. (2007). X-Ray Micro Tomography. Advanced Light Source, Lawrence Berkley National Laboratory.
Monicard, R. P. (1980). Properties of Reservoir Rocks – Core Analysis. Houston: Gulf Publishing Company.
Morgan, F., & Fulton, P. F. (1951). A New Technique for the Measurement of the Formation Factors and Resistivity Indices of Porous Media. Society of Petroleum Engineers, 2.
Nelson, P. H. (2009). Pore-throat sizes in sandstones, tight sandstones, and shales. AAPG, 329-340.
Okasha, T. M., & Funk, J. J. (2002). ELECTRICAL AND PETROPHYSICAL PROPERTIES OF SHU’AIBA RESERVOIR, SAUDI ARABIA. 6.
Parkhomenko, E. I. (2012). Electrical Properties of Rocks. Springer Science & Business Media.
Patnode, H. W., & Wyllie, M. J. (1950). The Presence of Conductive Solids in Reservoir Rocks as a factor in Electric Log Interpretation. AIME, 47-52.
(1998). Recommended Practices for Core Analysis. API.
Rieu, M., & Sposito, G. (1990). Fractal Fragmentation, Soil Porosity, and Soil Water Properties: I. Theory. Soil Science Society of America, 1231-1238.
Salvo, L., Cloetens, P., Maire, E., Zabler, S., Blandin, J., Buffière, J.-Y., . . . Josserond, C. (2003). X-ray micro-tomography an attractive characterization technique in materials science. Nuclear instruments and methods in physics research section B: Beam interactions with materials and atoms, 200, 273-286.
Sethi, D. K. (1979). Some Considerations About The Formation Resistivity Factor – Porosity Relations. Society of Petrophysicists and Well-Log Analysts, 12.
Special Core Analysis. (2016). Retrieved from Intertrek: http://www.intertek.com/energy/upstream/scal-special-core-analysis/
Telford, W. M. (1990). Applied Geophysics, second edition. Cambridge University Press.
Ubani, C. E., Adeboye, Y. B., & Oriji, A. B. (2012). ADVANCES IN CORING AND CORE ANALYSIS FOR RESERVOIR FORMATION EVALUATION. Petroleum & Coal, 42-51.
Visher, G. S. (1969). Grain Size Distributions and Depositional Processes. Journal of Sedimentary Petrology, 1074-1106.
Wildenschild, D., Roberts, J. J., & Carlberg, E. D. (1999). Electrical Properties of Sand-Clay Mixture: The Effect of Microstructure. International Exposition and 69th Annual Meeting, 4.
Worthington, A. E. (1975). Errors In The Laboratory Measurement Of Formation Resistivity Factor. Society of Petrophysicists and Well-Log Analysts, 17.