
Intro
Gravity is a natural phenomenon in which bodies of mass are attracted (or gravitate) towards each other. This phenomenon is observed within objects of all sizes ranging from atoms to planets. Besides, the size of a body determines the magnitude of the force of attraction placed upon neighboring objects or objects within proximity. Moreover, the gravitational force of bodies is centered within their center of the body, indicating that the force is constant in all directions. Furthermore, various restrictions of the gravitational force can be attributed to the distance away from the center of the body, such as the mantle thickness which in turn restricts the gravitational forces of an object. Beyond the topographical and geological variations of the earth’s surface, the earth is also constantly rotating. Furthermore, variation in equatorial radii is also observed; where the radii are greater at the equator in comparison to the polar radius, this occurs due to the oblate spheroid shape. Therefore, the observed gravity is not constant at all latitudes and we understand this phenomenon as gravitational anomalies.
Moreover, gravity plays a vital role in all of the earth’s natural processes ranging such as ocean current circulation and isotopic gas circulation to orogeny and tectonic plate movements. Therefore, geoscientist uses accurate calculations of gravity at a plethora of latitudes and longitudes to accurately calculate the rate and age of various geophysical processes. To obtain these accurate calculations across the earth’s surface, geoscientists utilize formulas that account for the geophysical variations at different sites of examination. The corrections that are commonly utilized are the free air correction and Bouguer correction; the free-air correction takes into account the increased elevation and the subsequent change in the gravitational forces, with the key assumption that there is no significant density between the two objects (hence free-air).On the other hand, the Bouguer variation takes into account the changes in the gravitational forces of attraction due to the increased elevations, with the key assumption that the mass between the objects possesses a significant density that should be accounted for. Furthermore, these corrections are utilized at the Poe Paddy State Park to better understand gravitational variations with crustal features.
Method
To achieve this goal of quantitively and qualitatively identifying the variations in gravitational forces throughout different topological features. Firstly, the relative gravity is measured along a transect that crossed over the bridge in addition to the interior portion of the tunnel. It is hypothesized that the air under the bridge is less dense than the surrounding solidus rock, therefore, the gravitational forces under the bridge are weaker than its surroundings and the free-air correction is utilized within this scenario.
Furthermore, the cylindrical nature of the tunnel facilitated a gravitational force that attracts objects towards the ceilings of the tunnel, which in turn combats the gravitational force of the earth pulling objects towards it. As a result, the gravitational acceleration is expected to decrease within this scenario also. Therefore, the Bouguer correction is utilized for this comparison identifying that the density of the was significant in comparison to the surrounding “stable” environment. A common formula utilized to determine the gravitational forces at varying latitudes is, where g=978, 031.85 mGal;
g(λ) = g (1 + 0.005278895 × sin2 (λ) + 0.000023462 × sin4 (λ))
However, this formula does not take into account the free-air correction. We observe that gravity decreases constantly as the distance between two objects is squared, as a result, we expect the observed gravity measurements to decrease as elevation increases. Furthermore, a key assumption is made that there is only free air beneath the object and the observed gravity at the reference point. Therefore, we can utilize the following formula to determine the free air correction;
δgF = z( 2g/ R)
Where the R is the earth’s radius and z is the elevation above the reference point. This free air correction is then paired with the observed and expect gravitational forces at the location being examined to determine the free-air anomaly;
free−air = observed − g(λ) + δgF
A map of the areas examined at Poe Paddy State Park was created and the observed gravity at every site of examination was tabulated. Furthermore, a drift correction was applied to the data collected and the latitude of 40.8oN was used to calculate the absolute reference gravity. The drift-corrected data was then converted to milligrams. More specifically, the first site that data was collected at; before the entrance of the bridge was used as the reference point to calculate the absolute changes in the observed gravity values.
Moreover, the Bouguer correction is used to analyze the effects of various geophysical properties on gravity. In comparison to the free-air correction and the absolute reference gravity calculations; the Bouguer correction takes into account variations in density with elevation. This is done by comparing gravity calculations to the gravitational effects of density variations below the reference point. This information is then used to make accurate gravity calculations at similar sites that display different topographic variations in density. Therefore, the formula below is used to calculate the additional gravitational effect(δgB) in semi-infinite slabs, where h is the slab thickness, G is the reference gravity at a specified latitude, y is depth to the middle, x is depth at the edge at position x and ρc is the difference in density in comparison to its surrounding material;
δgB = 2Gρch(2π + tan−1 ( x /y ))
Furthermore, the Bouguer anomaly can be calculated using;
δB = free−air – δgB
Moreover, the method of superimposing two semi-infinite slabs was utilized to determine the gravitational effects of the tunnel. Furthermore, a key assumption made in this calculation is that the stream and roof are infinite in their width and thickness. These approximations are then used for comparison between the measured free air-anomaly values. Furthermore, the values of thickness and length within the tunnel were adjusted to better understand their impact on the result and the magnitude of the uncertainty.
Results and discussion
Part 1
- schematic map
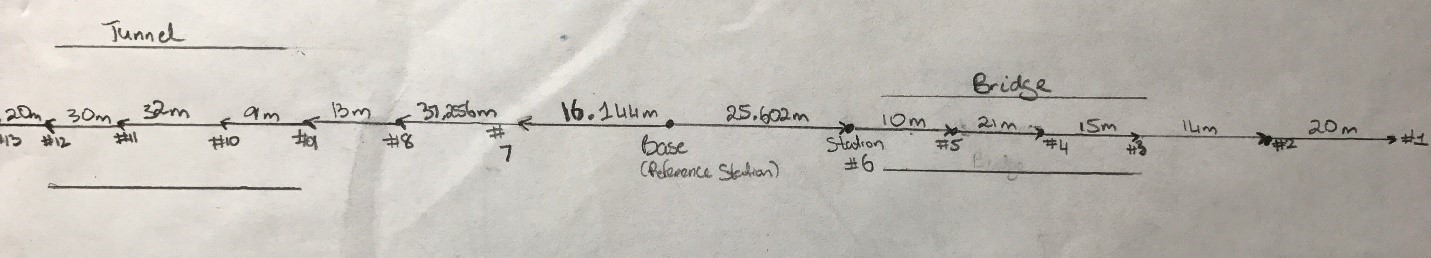
| Field trip #1 | ||||||
| Station | Location | Counter reading | Time | Time elapsed(m) | Drift-corrected | g (meal) |
| Base | Base | 3784.770 | 10:02 | 0 | 3784.77000 | 3878.39822 |
| 1 | The far side of the bridge | 3784.610 | 10:17 | 17 | 3784.60235 | 3878.2265 |
| 2 | The far side of the bridge | 3784.710 | 10:28 | 26 | 3784.69830 | 3878.32477 |
| 3 | Bridge | 3784.410 | 10:42 | 40 | 3784.39200 | 3878.01104 |
| 4 | Bridge | 3784.330 | 10:49 | 47 | 3784.30885 | 3877.92587 |
| 5 | Bridge | 3784.490 | 10:56 | 54 | 3784.46570 | 3878.08653 |
| 6 | Just off bridge | 3784.776 | 11:06 | 64 | 3784.74720 | 3878.37486 |
| 7 | Past base station towards the tunnel | 3784.745 | 11:15 | 73 | 3784.71215 | 3878.33896 |
| Base | Base | 3784.806 | 11:22 | 80 | 3784.77000 | 3878.39822 |
| Field Trip #2 | ||||||
| Base | Base | 3784.435 | 2:37 | 0 | 3784.435 | 3878.05508 |
| 8 | Towards tunnel | 3784.350 | 2:47 | 10 | 3784.28519 | 3877.90163 |
| 9 | Outside tunnel | 3783.955 | 2:53 | 16 | 3783.851304 | 3877.45721 |
| 10 | Tunnel | 3783.520 | 2:59 | 22 | 3783.377418 | 3876.97182 |
| 11 | Tunnel | 3782.812 | 3:05 | 28 | 3782.630532 | 3876.2068 |
| 12 | Tunnel | 3782.970 | 3:13 | 36 | 3782.736684 | 3876.31553 |
| 13 | Outside the far end of the tunnel | 3783.865 | 3:22 | 45 | 3783.573355 | 3877.17252 |
| Base | Base | 3784.785 | 3:31 pm | 54 | 3784.435026 | 3878.05511 |
Poe Paddy State Park reference gravity
Reference gravity baes on 40.8oN;
g(λ) = g (1 + 0.005278895 × sin2 (λ) + 0.000023462 × sin4 (λ))= 980240.3886969 mgal
free air correction;
δgF = z( 2g/ R)
where; R=6371000 m, z(elevation above sea level)= 296.9 m, g=980240.3886969 meal
Therefore, δgF= 91.361912
However, to obtain the free-air correction as a function of elevation; dg/dR=−2g/R=-0.3077mGal/m. Therefore, the free-air correction as a function of elevation= h(0.3077mGal).In addition Poe Paddy sits 296.9 meters above sea level therefore the free-air correction=269.9(0.3077)= 83.04 mGal.
Reference gravity based on individual sites
The reference site chose for field trip #1 was the base, displaying a value of 3878.39822 mg.
Example;
Absolute gravity Station #1 =base – observed value=3878.39822-3878.2265=0.17172
Field trip #1;
| Station | Absolute gravity |
| Base | 0.00000 |
| 1 | 0.17172 |
| 2 | 0.07344 |
| 3 | 0.38718 |
| 4 | 0.47235 |
| 5 | 0.31169 |
| 6 | 0.02335 |
| 7 | 0.05925 |
| Base | 0.00000 |
Field trip #2;
| station | Absolute gravity |
| Base | 0 |
| 8 | 0.153447387 |
| 9 | 0.597868139 |
| 10 | 1.083260091 |
| 11 | 1.848280483 |
| 12 | 1.739551112 |
| 13 | 0.882565741 |
| Base | 0 |
Free-air anomalies
Using the formula; free−air = observed − g(λ) + δgF, free-air anomalies are calculated and tabulated below.
free−air = observed − g(λ) + δgF
| Station | Location | Free air anomalies |
| Base | Base | -976361.99048 |
| 1 | The far side of the bridge | -976362.35728 |
| 2 | The far side of the bridge | -976362.21470 |
| 3 | Bridge | -976362.43151 |
| 4 | Bridge | -976362.51021 |
| 5 | Bridge | -976362.33202 |
| 6 | Just off bridge | -976362.10338 |
| 7 | Past base station towards the tunnel | -976362.06974 |
| Base | Base | -976361.99048 |
As hypothesized, the greatest free-air corrections are observed on the bridge as the object is suspended in free-air and the gravitational forces are weakened as the distance increases.